profiling is not understanding
This might seem like an obvious distinction, but all too often, efforts at improving performance focus on the small picture ("this thing here is slow") and not the bigger picture ("why is this so slow"). At Jolla, I had the pleasure of running into one such instance of this, together with Gunnar Sletta, my esteemed colleague, and friend.
As those of you who are familiar with Jolla may know, we had been working on upgrading to a newer Qt release. This also involved quite a bit of work for us, both in properly upstreaming work we had done on the hurry to the late-2013 release, and in isolating problems and fixing them properly in newer code (the new scenegraph renderer, and the v4 javascript engine in particular have been an interesting ride to get both at once!).
As a part of this work, we noted that touch handling was quite slow (something which we had worked around for our initial release, but now wanted to solve properly). This was due to the touch driver on the Jolla introducing touchpoints faster than the display was updating, that is, while the display might be updating at 57 hz (yes, the Jolla is weird, it doesn't do 60 hz) - we might be getting input events a lot more frequently than that.
This was, in turn, causing QtQuick to run touch processing (involving costly item traversals, as well as the actual processing of touch handling) a lot more frequently than the display was updating. As these took so much time, this in turn slowed rendering down, meaning even more touch handling was going on per frame. A really ugly situation.
 |
| Figure 1: Event tracing inside the Sailfish OS Compositor |
With the explanation out of the way, let's look at the details a bit more. It's obvious that the event thread is regularly delivering events at around-but-not-quite twice the display update. Our frame preparation on the GUI thread looks good, despite the too-frequent occurrence of event delivery, though, and the render thread is coping too.
But this isn't a major surprise - the compositor in this case is dead simple (just showing a fullscreen client). What about the client? Let's take a look at it over the same timeframe...
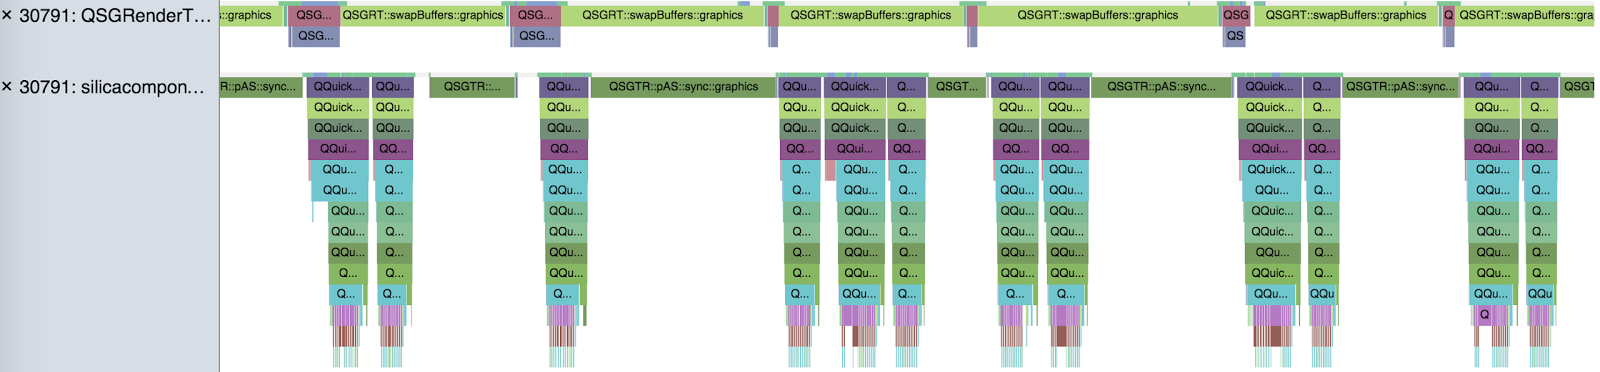 |
| Figure 2: Event tracing for the client (Silica's component gallery, in this case) |
Here, it's very clear that touch processing is happening way too often, and worse than that, it's taking a very long time (each touch event's processing is taking ~4ms), not leaving much time for rendering - and this was on a completely unloaded device. In a more complicated client still, this impact would be much, much worse, leading to frame skipping (which we saw, on some other applications).
Going back to my original introduction here, if we had used traditional profiling techniques, we'd have seen that touch handling/preparation to render was taking a really long time. And we might have focused on optimizing that. Instead, thanks to some out-of-the-box thinking, we looked at the overall structure of application flow, and were able to see the real problem: doing extra work that wasn't necessary.
As an aside to this, I'm happy to announce that we worked out a neat solution to this: QtQuick now doesn't immediately process touch events, instead, choosing to wait until it is about to prepare the next frame for display - as well as "compressing" them to only deal with the minimal number of sensible touch updates per frame. This should have no real impact on any hardware where touch delivery was occurring at a sensible rate, but for any hardware where touch was previously delivering too fast, this will no longer be a problem as of Qt 5.4.
(Thanks to Gunnar & myself for the fix, Carsten & Mikko for opening my eyes about performance tooling, and Jolla for sponsoring this work.
P.S. If you're looking for performance experts, Qt/QML/etc expertise or all round awesome, Gunnar and myself are currently interested in hearing from you.)